May 21, 2026May 21, 2026News IGFA Names First Recipients of the Master Angler Award IGFA Names First Recipients of the Master Angler Award Dr. […]
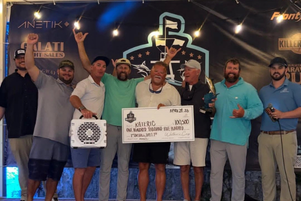
May 19, 2026May 19, 2026Events, News, Tournaments Recapping the 2026 IGFA Walker’s Cay Shootout Recap of the 2026 IGFA Walker’s Cay Shootout Walker’s Cay […]
May 19, 2026Conservation, Forage Fish, News Announcing the 2026 Forage Fish Research Program Data Workshop Announcing the 2026 Forage Fish Research Program Data Workshop On […]
May 19, 2026News, World Records, World Records World Records for May 2026 Newly Approved IGFA World Records To see all newly approved […]
May 19, 2026News, Slam Clubs, Trophy Clubs Slam & Trophy Clubs for May 2026 Newly Approved Slam & Trophy Fish Clubs To see […]
May 19, 2026Education, Education Partners, News Announcing the 2026 IGFA Summer Education Camps Announcing the 2026 IGFA Summer Education Camps The busy camp […]
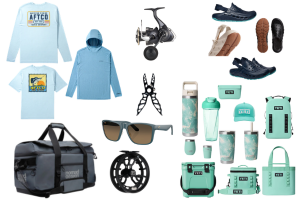
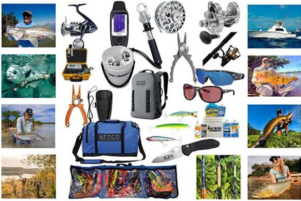
May 19, 2026May 19, 2026Gadgets and Gear, News New Products for May 2026 New Products To have your new product featured, we invite […]
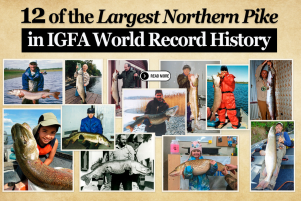
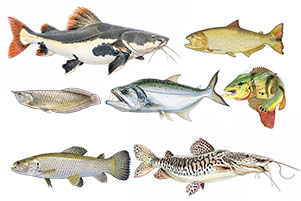
May 19, 2026News, Uncategorized, World Records 12 of the Largest Northern Pike in IGFA World Record History 12 of the Largest Northern Pike in IGFA World Record […]
May 19, 2026Annual Auction, Events, News IGFA Day Online Auction – How to Join the Action IGFA Day Online Auction How to Join the Action May […]
May 14, 2026News IGFA Announces New South American Royal Slam IGFA Announces New South American Royal Slam New program celebrates […]
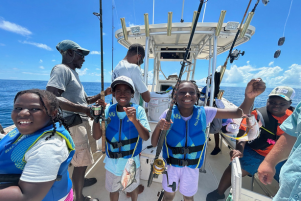
May 12, 2026May 18, 2026Angler Recognition, News, Representatives The IGFA at Project SeaSafe 2026: Clean Water, Conservation, and the Bouncer Smith Celebrity Inshore Slam The IGFA at Project SeaSafe 2026: Clean Water, Conservation, and […]
May 6, 2026May 15, 2026News IGFA Introduces the Master Angler Program IGFA Introduces the Master Angler Program, a New Lifetime Achievement Initiative […]